About Confidence Interval
Confidence Interval Applies Only On Sample Data
The concept of Confidence Interval (CI) only applies when you are dealing with sample data and not the full population of data. Please note that when you are analyzing anything with full population of data, confidence interval becomes redundant.
In fact CI calculated from a sample tells the confidence level about the population from which the sample was drawn.
Probably the most often used descriptive statistic is the mean. The mean is a particularly informative measure of the "central tendency" of the variable if it is reported along with its confidence intervals. As mentioned earlier, usually we are interested in statistics (such as the mean) from our sample only to the extent to which they can infer information about the population. The confidence interval for the mean gives us a range of values around the mean where we expect the "true" (population) mean is located. For example, if the mean in your sample is 23, and the lower and upper limits of the p=.05 confidence interval are 19 and 27 respectively, then you can conclude that there is a 95% probability that the population mean is greater than 19 and lower than 27.
P-Level & Confidence Interval
If you set the p-level to a smaller value, then the interval would become wider thereby increasing the "certainty" of the estimate, and vice versa; as we all know from the weather forecast, the more "vague" the prediction (i.e., wider the confidence interval), the more likely it will materialize. Note that the width of the confidence interval depends on the sample size and on the variation of data values. The larger the sample size, the more reliable it’s mean. The larger the variation, the less reliable the mean.
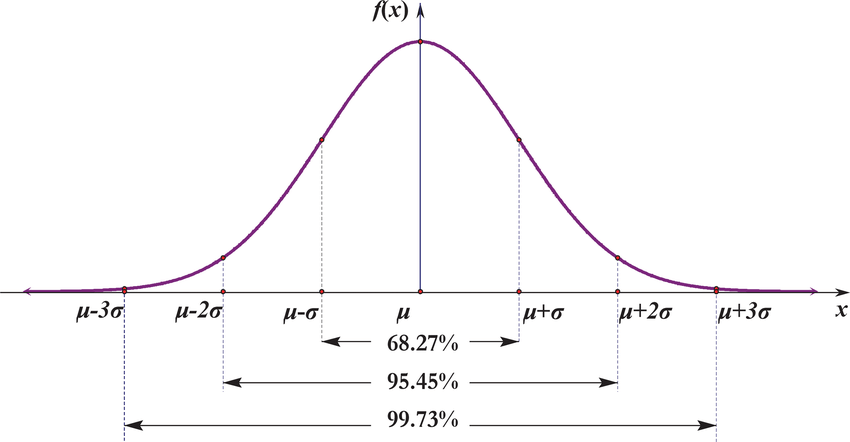
The calculation of confidence intervals is based on the assumption that the variable is normally distributed in the population. The estimate may not be valid if this assumption is not met, unless the sample size is large, say n=100 or more.
When you compute a confidence interval, you compute the mean of a sample in order to estimate the mean of the population. Clearly, if you already knew the population mean, there would be no need for a confidence interval. However, to explain how confidence intervals are constructed, we are going to work backwards and begin by assuming characteristics of the population. Then we will show how sample data can be used to construct a confidence interval.
Variance & Confidence Interval
When the variance is not known but has to be estimated from sample data you should use the t distribution rather than the normal distribution. When the sample size is large, say 100 or above, the t distribution is very similar to the standard normal distribution. However, with smaller sample sizes, the t distribution is leptokurtic, which means it has relatively more scores in its tails than does the normal distribution. As a result, you have to extend farther from the mean to contain a given proportion of the area.
More generally, the formula for the 95% confidence interval on the mean is:
Lower limit = M - (tCL)(sm)
Upper limit = M + (tCL)(sm)
where M is the sample mean, tCL is the t for the confidence level desired (0.95 as an example), and sm is the estimated standard error of the mean.