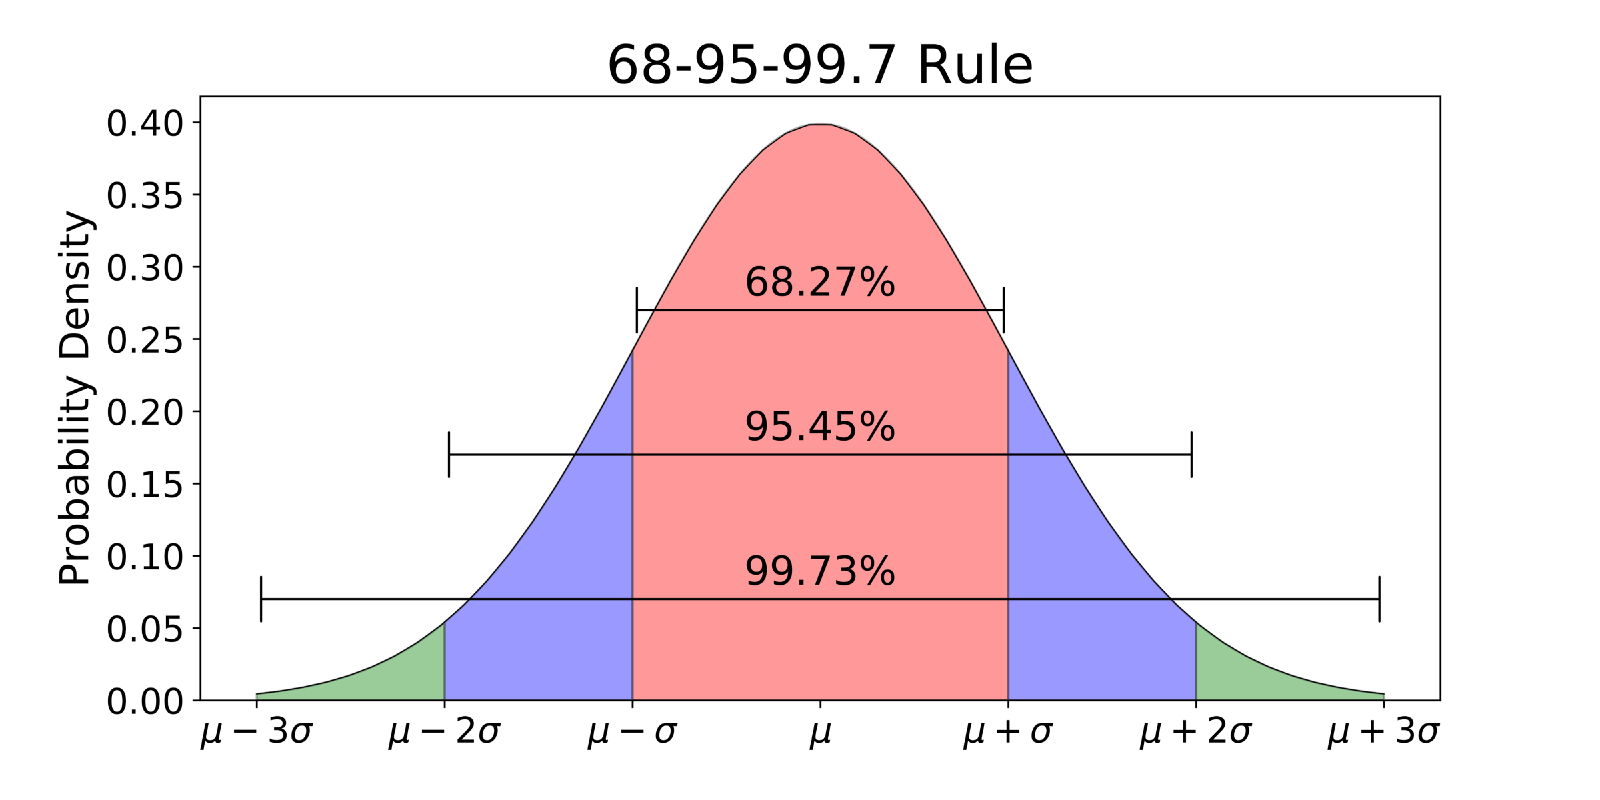
Normal Distribution
The Normal Distribution of Data

The "normal distribution" of data is important, which in simple words mean the bell curve of data spread. Half on one side of ‘mean’ and half on other side of ‘mean’. If the average weight of class of 50 students is 60 kgs. Then the range may be between 40 to 80 kg. Half may fall between 40 & 60 and other half between 60 & 80. This will provide us bell shaped graph of data which is called ‘normal distribution’.
The distribution of many test statistics is normal or follows some form that can be derived from the normal distribution. In this sense, philosophically speaking, the normal distribution represents one of the empirically verified elementary "truths about the general nature of reality," and its status can be compared to the one of fundamental laws of natural sciences. The exact shape of the normal distribution (the characteristic "bell curve") is defined by a function that has only two parameters: mean and standard deviation.
A characteristic property of the normal distribution is that 68% of all of its observations fall within a range of ±1 standard deviation from the mean, and a range of ±2 standard deviations includes 95% of the scores. In other words, in a normal distribution, observations that have a standardized value of less than -2 or more than +2 have a relative frequency of 5% or less. (Standardized value means that a value is expressed in terms of its difference from the mean, divided by the standard deviation.
Is All Data Normally Distributed?
Not all, but most of them are either based on the normal distribution directly or on distributions that are related to and can be derived from normal such as t, F, or Chi-square. Typically, these tests require that the variables analyzed are themselves normally distributed in the population, that is, they meet the so-called "normality assumption." Many observed variables actually are normally distributed, which is another reason why the normal distribution represents a "general feature" of empirical reality.
The problem may occur when we try to use a normal distribution based test to analyze data from variables that are themselves not normally distributed. In such cases, we have two general choices. First, we can use some alternative "nonparametric" test (or so-called "distribution-free test" , but this is often inconvenient because such tests are typically less powerful and less flexible in terms of types of conclusions that they can provide. Alternatively, in many cases we can still use the normal distribution based test if we only make sure that the size of our samples is large enough.
The latter option is based on an extremely important principle that is largely responsible for the popularity of tests that are based on the normal distribution function. Namely, as the sample size increases, the shape of the sampling distribution approaches normal shape, even if the distribution of the variable in question is not normal. However, as the sample size increases, the shape of the sampling distribution becomes normal.