Statistical Significance
What is Statistical Significance (p -value)

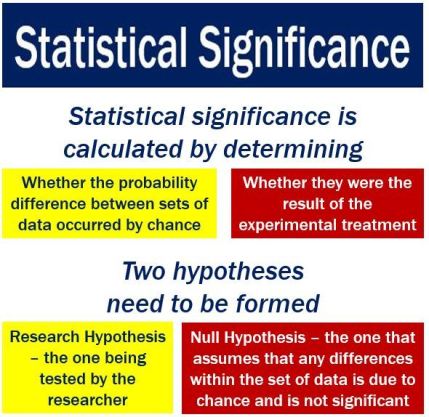
The statistical significance of a result is the probability that the observed relationship (e.g., between variables) is significant or believable and at the same time what is the other part of the same result which occurred by pure chance ("luck of the draw"), and that in the population from which the sample was drawn.
Using less technical terms, we could say that the statistical significance of a result tells us something about the degree to which the result is "true" (in the sense of being "representative of the population"). E.g. 95% correct or significant or believable and at the same time 5% may be defective, incorrect or occurred by chance (fluke)- By the way this part is called p-value – the probability of error.
More technically, the value of the p-value represents a decreasing index of the reliability of a result. The higher the p-value, the less we can believe that the observed relation between variables in the sample is a reliable indicator of the relation between the respective variables in the population.
Specifically, the p-value represents the probability of error that is involved in accepting our observed result as valid, that is, as "representative of the population." For example, a p-value of .05 (i.e.,1/20) indicates that there is a 5% probability that the relation between the variables found in our sample is a "fluke." In other words, assuming that in the population there was no relation between those variables whatsoever, and we were repeating experiments such as ours one after another, we could expect that approximately in every 20 replications of the experiment there would be one in which the relation between the variables in question would be equal or stronger.

How to Determine that a Result is "Really" Significant or Believable…
There is no way to avoid arbitrariness in the final decision as to what level of statistical significance will be treated as really "significant." That is, the selection of some level of significance, up to which the results will be rejected as invalid, is arbitrary. In practice, the final decision usually depends on whether the outcome was predicted prior or only found later in the course of many analyses and comparisons performed on the data set, on the total amount of consistent supportive evidence in the entire data set, and on "traditions" existing in the particular area of research.
Typically, in many sciences, results that yield p .05 are considered borderline statistically
significant, but remember that this level of significance still involves a pretty high probability of error (5%). Results that are significant at the p .01 level are commonly considered statistically significant, and p .005 or p .001 levels are often called "highly" significant.
But remember that these classifications represent nothing else but arbitrary conventions that are only informally based on general research experience.
Number of Analyses to be Performed for Statistical Significance
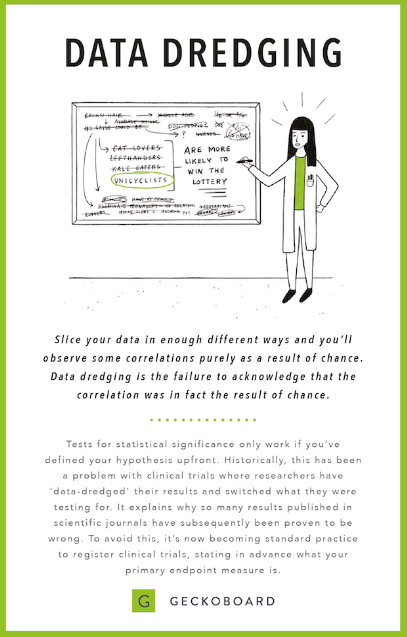
Needless to say, the more analyses you perform on a data set, the more results will meet "by chance" the conventional significance level. For example, if you calculate correlations between ten variables (i.e., 45 different correlation coefficients), then you should expect to find by chance that about two (i.e., one in every 20) correlation coefficients are significant at the p .05 level, even if the values of the variables were totally random and those variables do not correlate in the population.
Some statistical methods to determine statistical significance involve many comparisons and, thus, a good chance for such errors include some "correction" or adjustment for the total number of comparisons. However, many statistical methods (especially simple exploratory data analyses) do not offer any straightforward remedies to this problem. Therefore, it is up to the researcher to carefully evaluate the reliability of unexpected findings.

Why Stronger Relations between Variables are More Significant
Assuming that there is no relation between the respective variables in the population, the most likely outcome would be also finding no relation between these variables in the research sample. Thus, the stronger the relation found in the sample, the less likely it is that there is no corresponding relation in the population. As you see, the magnitude and significance of a relation appear to be closely related, and we could calculate the significance from the magnitude and vice-versa; however, this is true only if the sample size is kept constant, because the relation of a given strength could be either highly significant or not significant at all, depending on the sample size.
If there are very few observations, then there are also respectively few possible combinations of the values of the variables and, thus, the probability of obtaining by chance a combination of those values indicative of a strong relation is relatively high.
Small Relations Can be Proven Significant Only in Large Samples
If a relationship between variables in question is "objectively" (i.e., in the population) small, then there is no way to identify such a relation in a study unless the research sample is correspondingly large. Even if our sample is in fact "perfectly representative," the effect will not be statistically significant if the sample is small. Analogously, if a relation in question is "objectively" very large, then it can be found to be highly significant even in a study based on a very small sample.
Calculating the Level of Statistical Significance
Let's assume that we have already calculated a measure of a relation between two variables. The next question is "how significant is this relation?" For example, is 40% of the explained variance between the two variables enough to consider the relation significant? The answer is "it depends."
Specifically, the statistical significance depends mostly on the sample size. As explained, in very large samples, even very small relations between variables will be significant, whereas in very small samples even very large relations cannot be considered reliable (significant).
Thus, in order to determine the level of statistical significance, we need a function that represents the relationship between "magnitude" and "significance" of relations between two variables, depending on the sample size.
The function we need would tell us exactly how likely it is to obtain a relation of a given magnitude (or larger) from a sample of a given size, assuming that there is no such relation between those variables in the population.
In other words, that function would give us the significance (p) level, and it would tell us the probability of error involved in rejecting the idea that the relation in question does not exist in the population. This "alternative" hypothesis (that there is no relation in the population) is usually called the null hypothesis.